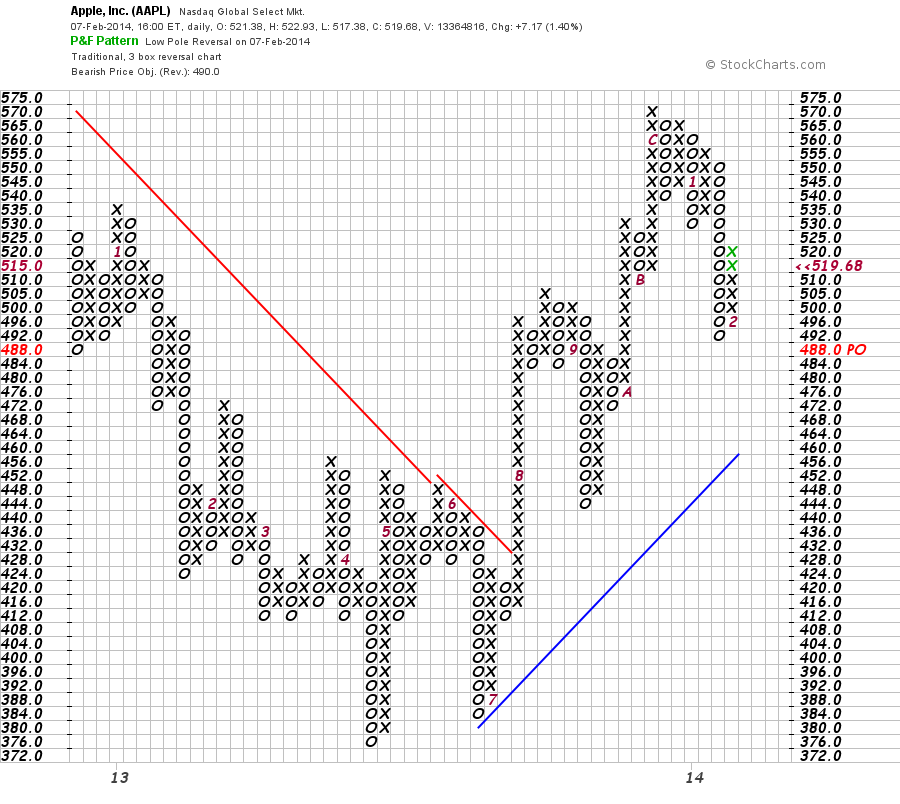
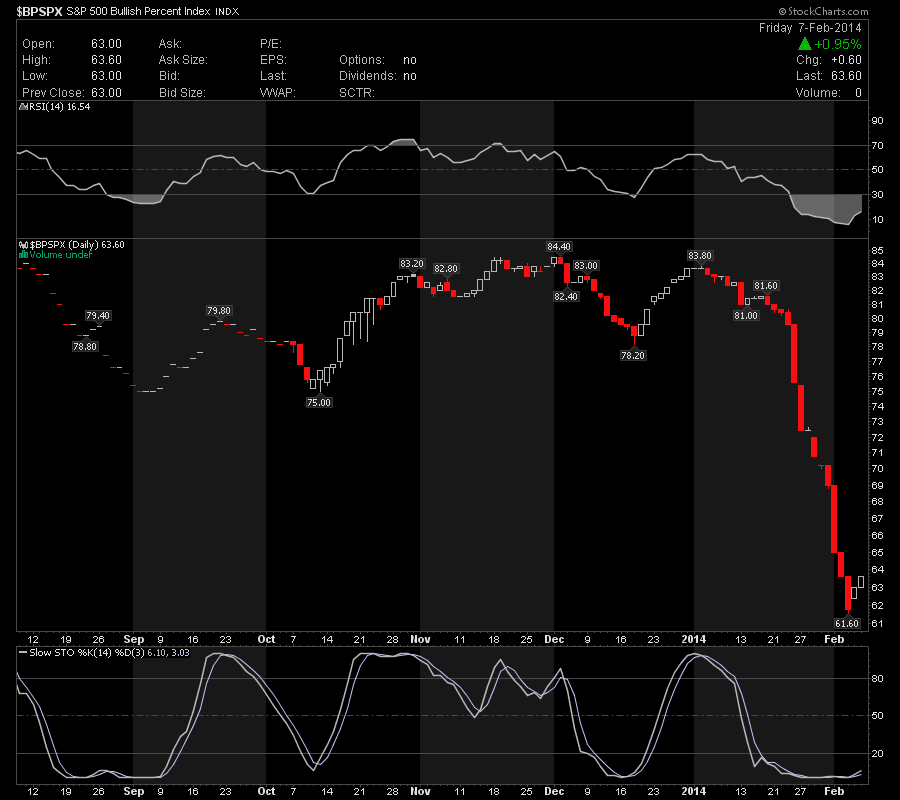
I'm posting the S&P500 Bullish Index, this index is using Point and Figure charts for every securities listed on the S&P500 Index. Here is a exemple of Point and Figure charting (above). Below is the S&P500 Bullish Index showing a reversal formation from the bearish market, we may still be in a bullish trend.
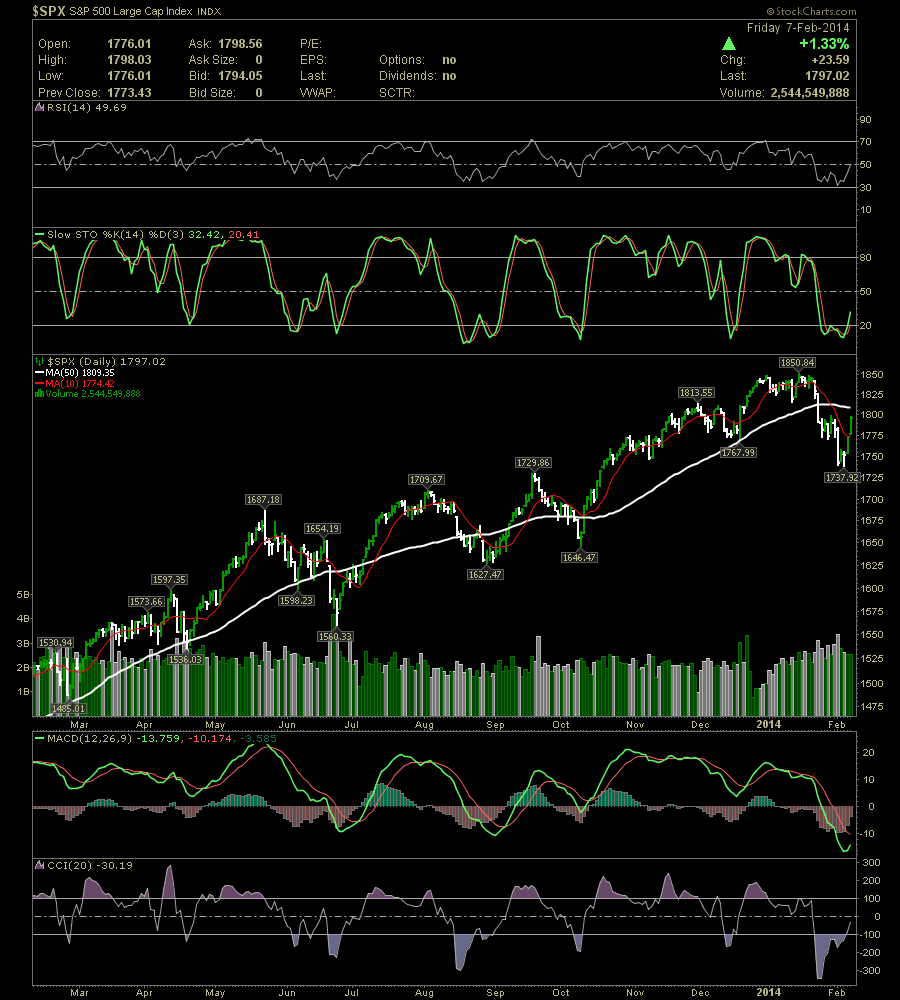
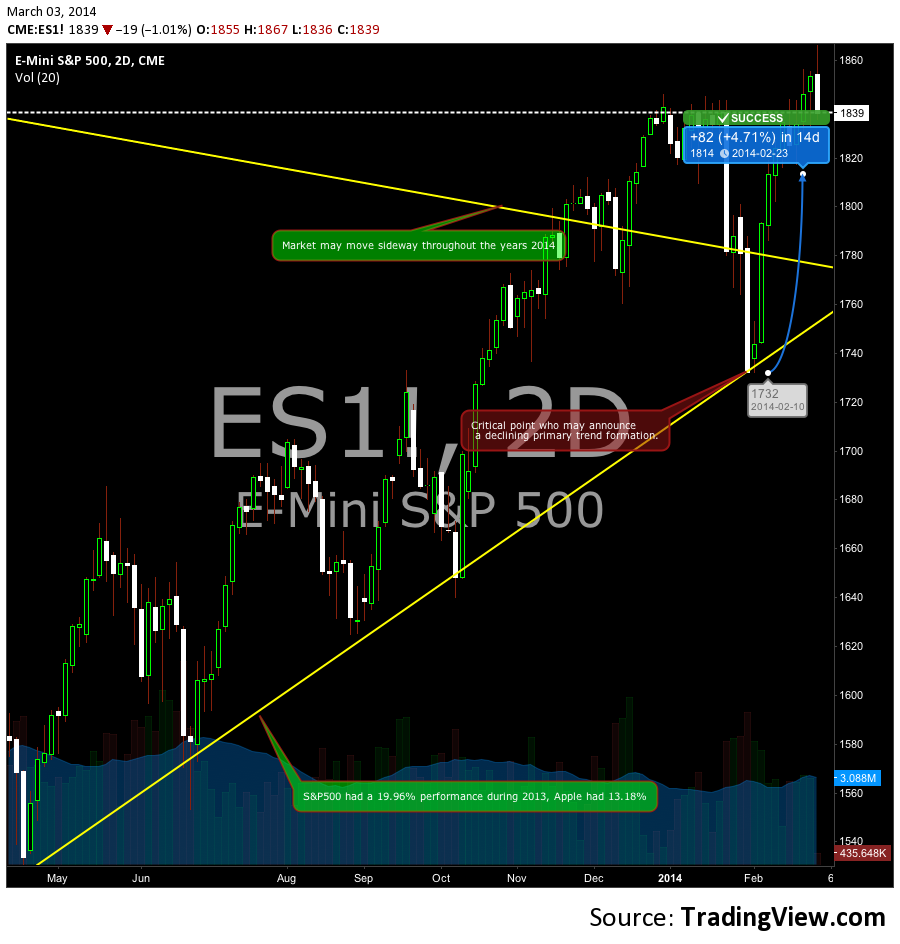
As you can see the S&P500 Index recovered within 2 days, it remain to see what will occur this week. The symbol $BPSPX from www.stockcharts.com is a good market indicator of the S&P500 Index Bullishness. One of the main benefit of using a different symbol for tracking the market behaviour is to avoid losing focus on the Primary Trend. Once we get a little more indepth on the analysis you will see how we will use Futures Contract Charts to optimize our futur expectation of the market.